
Advanced Certificate in Mastering Data Visualization with Tableau and Power BI
Flexible Learning
24/7 Support
Enrol & Start Anytime
Recommended Learning Hours : 2-4 Hrs/Week
Course Fee
£49
Or Equivalent Local Currency
Advanced Certificate in Mastering Data Visualization with Tableau and Power BI
£49
• 2 MonthsAssessment Type
Quiz Based
Non Credit Bearing
Qualification
Duration
2 Months
Pedagogy
Online
Learning Style
Self Paced
Course Overview
Unlock Data Insights with Advanced Visualization Skills
This course is designed for professionals seeking to enhance their data visualization skills using Tableau and Power BI. It's ideal for data analysts, business intelligence developers, and data scientists looking to create interactive and dynamic dashboards. Students will gain hands-on experience with advanced features and best practices in both tools.
By completing this course, participants will be able to effectively communicate complex data insights, create engaging stories, and drive business decisions with data-driven visualizations. They will master advanced techniques, including data modeling, visualization design, and report development, to become proficient data visualization specialists.
Description
Unlock the Power of Data Visualization.
Take your data analysis skills to the next level with our Advanced Certificate in Mastering Data Visualization with Tableau and Power BI. In this comprehensive course, you'll learn to effectively communicate insights and trends, making complex data accessible to everyone.
Gain expertise in both Tableau and Power BI, and discover how to create interactive dashboards, reports, and stories that drive business decisions. With hands-on training and real-world projects, you'll be equipped to tackle even the most challenging data visualization tasks.
Boost your career prospects in data science, business intelligence, and analytics. Our course is designed for professionals and students seeking to upskill and reskill in a rapidly evolving job market. Upon completion, you'll be ready to take on new challenges and opportunities in this exciting field.
Key Features
Quality Content
Our curriculum is developed in collaboration with industry leaders to ensure you gain practical, job-ready skills that are valued by employers worldwide.
Created by Expert Faculty
Our courses are designed and delivered by experienced faculty with real-world expertise, ensuring you receive the highest quality education and mentorship.
Flexible Learning
Enjoy the freedom to learn at your own pace, from anywhere in the world, with our flexible online learning platform designed for busy professionals.
Expert Support
Benefit from personalized support and guidance from our expert team, including academic assistance and career counseling to help you succeed.
Latest Curriculum
Stay ahead with a curriculum that is constantly updated to reflect the latest trends, technologies, and best practices in your field.
Career Advancement
Unlock new career opportunities and accelerate your professional growth with a qualification that is recognized and respected by employers globally.
Topics Covered
- Data Visualization Fundamentals: Understanding key concepts and principles of data visualization.
- Data Preparation and Management: Preparing and managing data for effective visualization.
- Mastering Tableau for Data Visualization: Building interactive dashboards and visualizations using Tableau.
- Advanced Power BI for Data Analysis: Creating advanced reports and visualizations using Power BI.
- Storytelling with Data Visualization: Communicating insights effectively using data visualization techniques.
- Advanced Visualization Techniques and Best Practices: Applying advanced visualization techniques and design best practices.
Key Facts
Key Details:
Audience: Professionals, data analysts, business intelligence specialists.
Prerequisites: Basic knowledge of data analysis and visualization tools.
What You'll Achieve:
Outcomes:
Develop interactive data visualizations and dashboards.
Master data storytelling with Tableau and Power BI.
Enhance data-driven decision-making skills.
Why This Course
Considering data visualization training can seem overwhelming. However, one option stands out. The 'Advanced Certificate in Mastering Data Visualization with Tableau and Power BI' is an excellent choice.
Here are three benefits of this course:
Gain expertise in two leading tools, Tableau and Power BI, to stay competitive.
Learn from industry experts, applying practical knowledge to real-world challenges.
Enhance career prospects, unlocking opportunities in data analysis and visualization.
Course Podcast
Listen to industry experts discuss key concepts and real-world applications of this course.
Course Brochure
Download the detailed course brochure to learn more about Advanced Certificate in Mastering Data Visualization with Tableau and Power BI

Pay as an Employer
Request an invoice for your company to pay for this course. Perfect for corporate training and professional development.
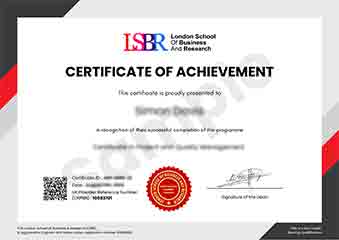
Sample Certificate
Preview the certificate you'll receive upon successful completion of this program.
Flexible Learning
24/7 Support
Enrol & Start Anytime
Recommended Learning Hours : 2-4 Hrs/Week
100% Online
Corporate Invoicing Available
What People Say About Us
Hear from our students about their experience with the Advanced Certificate in Mastering Data Visualization with Tableau and Power BI at LSBR.
Sophie Brown
United Kingdom"The course content was incredibly comprehensive and well-structured, providing a solid foundation in both Tableau and Power BI, which has greatly enhanced my ability to effectively communicate complex data insights to stakeholders. I've gained practical skills in creating interactive dashboards, performing data modeling, and leveraging data visualization best practices, which I believe will significantly boost my career prospects in the field of data analysis. The knowledge I've acquired has already started to impact my work, enabling me to deliver more impactful and engaging data-driven presentations."
Jia Li Lim
Singapore"This course has been instrumental in equipping me with the skills to effectively communicate complex data insights to stakeholders, which has significantly enhanced my ability to drive business decisions and strategy. The knowledge gained from mastering Tableau and Power BI has opened up new career opportunities and allowed me to take on more senior roles within my organization. The practical applications learned in this course have been directly applicable to my day-to-day work, enabling me to make a tangible impact on my company's data-driven initiatives."
Muhammad Hassan
Malaysia"The course structure effectively balanced theoretical foundations with practical exercises, allowing me to develop a deep understanding of data visualization tools and techniques. The expansive content covered a wide range of topics, from data manipulation to interactive storytelling, providing me with a solid foundation for real-world applications. This course has significantly enhanced my ability to effectively communicate insights and drive business decisions with data-driven visualizations."
More Courses You Might Like
Explore similar courses to expand your learning journey
From Our Blog
Insights and stories from our business analytics community
Unleashing Data-Driven Insights: Mastering Data Visualization with Tableau and Power BI
Unlock the power of data visualization with Tableau and Power BI, and transform your career with a comprehensive program that equips you with the skills to drive business success.
"Visualizing Success: How an Advanced Certificate in Mastering Data Visualization with Tableau and Power BI Can Elevate Your Career"
Master data visualization with Tableau and Power BI, and unlock a wide range of career opportunities in a data-driven world.
Revolutionizing Business Intelligence: Unlocking the Potential of Data Visualization with Tableau and Power BI
Discover the latest trends and innovations in data visualization with Tableau and Power BI and revolutionize your organization's business intelligence capabilities.