
Executive Development Programme in Advanced Data Visualization with Tableau and Power BI
Develop expertise in advanced data visualization with tableau and power bi with industry-leading techniques and practical applications. Transform your career potential now.
Executive Development Programme in Advanced Data Visualization with Tableau and Power BI
Programme Overview
The Executive Development Programme in Advanced Data Visualization with Tableau and Power BI is designed for senior business leaders, data analysts, and professionals aiming to enhance their data visualization skills to drive strategic decision-making. This comprehensive programme equips participants with the advanced techniques and tools necessary to transform raw data into compelling visual stories, optimizing business intelligence and insights.
Key skills and knowledge developed throughout the programme include the ability to create interactive dashboards, perform complex data modeling, and leverage advanced features of Tableau and Power BI. Participants will learn to integrate various data sources, apply advanced analytics, and develop effective data storytelling techniques. The programme also covers best practices in data visualization, ensuring that learners can communicate complex information clearly and persuasively to stakeholders.
This programme has a significant impact on career advancement, as participants gain the expertise to lead data-driven initiatives, improve operational efficiency, and support strategic business decisions. Graduates of this programme often assume roles such as data visualization lead, business intelligence analyst, or data strategy consultant, where they can leverage their enhanced skills to deliver tangible business value.
What You'll Learn
Transform your career with the 'Executive Development Programme in Advanced Data Visualization with Tableau and Power BI.' This comprehensive program is designed to equip business leaders with the skills needed to drive strategic decision-making through advanced data visualization techniques. Participants will gain in-depth knowledge of Tableau and Power BI, learning how to design, develop, and deploy interactive dashboards that transform complex data into actionable insights.
Key topics include data preparation, storytelling with data, advanced visualization techniques, and best practices for secure data management. Through hands-on projects, participants will apply these skills to real-world business scenarios, enhancing their ability to present data-driven arguments effectively to senior management.
Upon completion, graduates will be well-prepared to lead data initiatives across various industries, from finance to healthcare. Career opportunities abound, including roles as data visualization experts, business intelligence analysts, and data-driven product managers. This program not only sharpens your technical skills but also hones your ability to communicate complex data insights to non-technical stakeholders, making you an invaluable asset to any organization.
Programme Highlights
Industry-Aligned Curriculum
Developed with industry leaders for job-ready skills valued by employers worldwide.
Globally Recognised Certificate
Recognised by employers across 180+ countries as a mark of professional excellence.
Flexible Online Learning
Study at your own pace with lifetime access to all course materials and updates.
Instant Access
Start learning immediately — no application process or waiting period required.
Constantly Updated Content
Stay ahead with the latest industry trends, best practices, and emerging insights.
Career Advancement
87% of graduates report measurable career progression within 6 months of completion.
Topics Covered
- 1. Introduction to Data Visualization: Learners will understand the importance of data visualization and explore foundational concepts. They will gain practical skills in selecting appropriate visualization types and tools.
- 2. Data Preparation and Cleaning: Learners will study techniques for preparing and cleaning data for visualization. They will practice data manipulation and transformation using tools like Tableau Prep and Power Query.
- 3. Tableau Fundamentals: Learners will learn the basics of Tableau, including data connection, data blending, and creating simple visualizations. They will gain hands-on experience in building interactive dashboards.
- 4. Advanced Tableau Visualization Techniques: Learners will delve into advanced visualization techniques in Tableau, such as parameterization, calculated fields, and storytelling. They will create complex dashboards and publish them to Tableau Server.
- 5. Power BI Fundamentals: Learners will be introduced to Power BI, covering data connection, data modeling, and creating basic visualizations. They will practice setting up and configuring Power BI workspaces.
- 6. Advanced Power BI Visualizations and Reports: Learners will explore advanced features in Power BI, such as DAX, data modeling best practices, and creating dynamic reports. They will develop complex reports and dashboards.
- 7. Data Visualization Best Practices: Learners will study best practices for effective data visualization, including color theory, chart selection, and data storytelling. They will apply these principles to refine their visualizations.
- 8. Data Visualization in the Cloud: Learners will learn how to leverage cloud services for data visualization, including integration with Azure and AWS ecosystems. They will configure and deploy Tableau and Power BI in cloud environments.
- 9. Advanced Dashboard Design: Learners will focus on advanced dashboard design principles, including layout, interactivity, and user experience. They will create sophisticated dashboards that meet business needs.
- 10. Executive Communication through Data Visualization: Learners will learn how to effectively communicate insights through data visualization, including presentation techniques and storytelling. They will practice delivering compelling presentations to executive audiences.
What You Get When You Enroll
Secure checkout • Instant access • Certificate included
Key Facts
Audience: Data professionals, analysts, managers
Prerequisites: Basic Excel skills
Outcomes: Master Tableau, Power BI, data viz best practices
Ready to get started?
Join thousands of professionals who already took the next step. Enroll now and get instant access.
Enroll Now — $199Why This Course
Enhance Data Literacy: The program equips professionals with advanced skills in data visualization using Tableau and Power BI, crucial tools for interpreting complex data sets. This proficiency not only simplifies data presentation but also aids in making informed decisions, a skill highly valued in leadership roles.
Boost Career Opportunities: By mastering these tools, professionals can stand out in the job market. Both Tableau and Power BI are widely used in industries ranging from finance to healthcare, making certified professionals more attractive to employers. The program also includes training in data storytelling, a vital skill for communicating insights effectively.
Drive Business Insights: Participants learn to transform raw data into actionable insights, driving business strategy and improving performance. The curriculum covers best practices in data visualization and analytics, enabling professionals to provide deeper business intelligence that can lead to strategic decisions and operational improvements.
Your Path to Certification
Trusted by Professionals Worldwide
Course Brochure
Download our comprehensive course brochure with all details
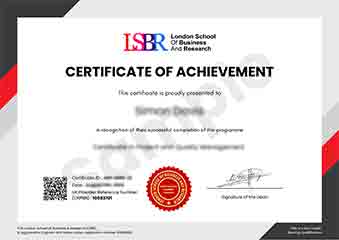
Sample Certificate
Preview the certificate you'll receive upon successful completion of this program.
Get Free Course Info
Enter your details and we'll send you a comprehensive course information pack straight to your inbox.
Employer Sponsored Training
Let your employer invest in your professional development. Request a corporate invoice and get your training funded.
Request Corporate InvoiceWhat People Say About Us
Hear from our students about their experience with the Executive Development Programme in Advanced Data Visualization with Tableau and Power BI at LSBRX - Executive Education.
Charlotte Williams
United Kingdom"The course content was incredibly comprehensive, providing a deep dive into both Tableau and Power BI, which significantly enhanced my data visualization skills. I now feel much more confident in creating impactful visualizations that can drive real business insights."
Tyler Johnson
United States"This course has been instrumental in enhancing my ability to create impactful visualizations that are highly relevant in the business world. It has not only deepened my technical skills in Tableau and Power BI but also provided me with practical tools to drive data-driven decisions, significantly advancing my career in data analytics."
Arjun Patel
India"The course structure is meticulously organized, providing a seamless transition from basic concepts to advanced techniques in data visualization, which significantly enhances my ability to create impactful visual stories. The comprehensive content and real-world applications have not only deepened my understanding but also prepared me for practical challenges in my professional role."