
Executive Development Programme in Building Effective Data Visualizations with R
This program equips executives with skills to create impactful data visualizations using R, enhancing decision-making and communication.
Executive Development Programme in Building Effective Data Visualizations with R
Programme Overview
The Executive Development Programme in Building Effective Data Visualizations with R is designed for professionals who need to enhance their data visualization capabilities using the R programming language. This program equips learners with the skills to create compelling and insightful visual representations of complex data, making it indispensable for business analysts, data scientists, and managers who require a deeper understanding of their data to drive strategic decisions. Participants will learn advanced techniques in data manipulation, visualization, and storytelling through R, integrating best practices and modern tools to ensure their visualizations are both accurate and engaging.
Key skills and knowledge learners will develop include proficiency in using R packages such as ggplot2 for creating high-quality graphics, understanding the principles of effective data visualization, and mastering techniques for data preparation and transformation. The program also covers best practices for storytelling with data, ensuring that visualizations not only present data effectively but also communicate the desired insights to diverse audiences. By the end of the program, learners will be adept at creating custom visualizations tailored to specific business needs, thereby enhancing their ability to influence decision-making processes.
The career impact of this programme is significant, as it equips participants with the skills to transform raw data into actionable insights. This capability is highly valued in today's data-driven business environment, allowing professionals to add substantial value to their roles. Whether it is improving project outcomes, enhancing customer experiences, or making strategic business decisions, the skills gained through this programme can lead to career advancement and increased job satisfaction.
What You'll Learn
The Executive Development Programme in Building Effective Data Visualizations with R is a transformative course tailored for professionals seeking to enhance their data storytelling capabilities. This program offers a comprehensive curriculum that covers essential topics such as R programming fundamentals, advanced data visualization techniques, and best practices for creating compelling and insightful visualizations. Participants will learn to leverage R’s robust libraries, such as ggplot2 and plotly, to transform complex data into accessible, meaningful visual stories.
By the end of the program, graduates will be equipped to create dynamic dashboards, interactive visualizations, and reports that effectively communicate data insights to stakeholders. This skill set is invaluable in today’s data-driven landscape, enabling professionals to make informed decisions, drive business strategies, and enhance data literacy within their organizations.
The program’s real-world applications extend to various sectors, including finance, healthcare, marketing, and technology, where participants can apply their skills to improve data analysis and communication. Graduates are well-prepared for advanced roles such as data analysts, data scientists, and business intelligence specialists, or can leverage these skills to excel in their existing roles by enhancing their data presentation abilities.
Join our program to unlock the power of data visualization with R and position yourself at the forefront of data-driven decision-making.
Programme Highlights
Industry-Aligned Curriculum
Developed with industry leaders for job-ready skills valued by employers worldwide.
Globally Recognised Certificate
Recognised by employers across 180+ countries as a mark of professional excellence.
Flexible Online Learning
Study at your own pace with lifetime access to all course materials and updates.
Instant Access
Start learning immediately — no application process or waiting period required.
Constantly Updated Content
Stay ahead with the latest industry trends, best practices, and emerging insights.
Career Advancement
87% of graduates report measurable career progression within 6 months of completion.
Topics Covered
- 1. Introduction to Data Visualization with R: Learners will understand the basics of data visualization using R, including installing R and RStudio, and creating simple plots. They will gain skills in setting up their environment and generating basic visualizations.
- 2. Foundations of Data Manipulation in R: This module covers essential data manipulation techniques using R packages like dplyr and tidyr. Learners will study how to clean, transform, and prepare data for visualization, enhancing their ability to work with complex datasets.
- 3. Statistical Concepts for Data Visualization: Learners will explore statistical concepts relevant to data visualization, such as distributions, correlations, and regression. They will learn how to apply these concepts to create more insightful and accurate visualizations.
- 4. Creating Effective Data Visualizations: This module focuses on designing effective data visualizations that communicate insights clearly. Learners will study principles of visual design and practice creating various types of charts and graphs.
- 5. Advanced Plot Customization in R: Learners will delve into advanced customization techniques for plots in R, including themes, annotations, and interactive elements. They will gain skills in tailoring visualizations to specific needs and contexts.
- 6. Geospatial Data Visualization with R: This module introduces geospatial data visualization using R packages like leaflet and ggmap. Learners will learn how to create maps and integrate geospatial data into their visualizations.
- 7. Time Series Analysis and Visualization: Learners will study time series analysis and visualization techniques, including decomposing time series data and creating time series plots. They will gain skills in analyzing and visualizing temporal data effectively.
- 8. Building Interactive Web Applications with Shiny: This module teaches learners how to build interactive web applications using Shiny, an R package for creating web-based data visualizations. They will learn to create dynamic and interactive dashboards.
- 9. Case Studies in Data Visualization: Through real-world case studies, learners will apply their skills to solve practical problems in data visualization. They will analyze and visualize data from various industries and contexts.
- 10. Advanced Topics in Data Visualization: This final module covers advanced topics such as machine learning for data visualization, large-scale data handling, and ethical considerations in data visualization. Learners will expand their expertise and prepare for advanced roles in data visualization.
What You Get When You Enroll
Secure checkout • Instant access • Certificate included
Key Facts
Audience: Data analysts, business intelligence professionals
Prerequisites: Basic R programming knowledge
Outcomes: Create effective visualizations, enhance data storytelling skills
Ready to get started?
Join thousands of professionals who already took the next step. Enroll now and get instant access.
Enroll Now — $199Why This Course
Enhance Analytical Skills: Participating in the Executive Development Programme in Building Effective Data Visualizations with R can significantly enhance your analytical skills. The program teaches you to use R, a powerful programming language for data analysis and visualization, to extract insights from complex data sets. This skill is highly valued in roles requiring data interpretation and decision-making.
Boost Career Versatility: The program equips you with a versatile skill set that can be applied across various industries, from finance to healthcare. By mastering data visualization techniques, you become a more valuable asset in your organization, capable of presenting data in a comprehensible manner to stakeholders, thereby improving communication and decision-making processes.
Gain Competitive Advantage: In today’s data-driven market, professionals who can effectively communicate data insights through visual means are in high demand. The program not only teaches you to create compelling visualizations but also to understand the psychology behind data communication, helping you stand out in the job market. Employers value candidates who can transform raw data into actionable insights, making you a sought-after professional in data analysis roles.
Your Path to Certification
Trusted by Professionals Worldwide
Course Brochure
Download our comprehensive course brochure with all details
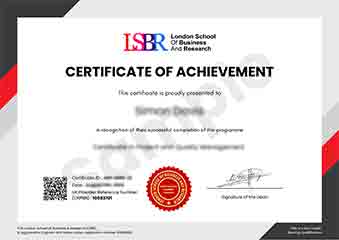
Sample Certificate
Preview the certificate you'll receive upon successful completion of this program.
Get Free Course Info
Enter your details and we'll send you a comprehensive course information pack straight to your inbox.
Employer Sponsored Training
Let your employer invest in your professional development. Request a corporate invoice and get your training funded.
Request Corporate InvoiceWhat People Say About Us
Hear from our students about their experience with the Executive Development Programme in Building Effective Data Visualizations with R at LSBRX - Executive Education.
James Thompson
United Kingdom"The course provided high-quality, detailed materials that significantly enhanced my ability to create effective data visualizations using R. I gained practical skills that have already proven invaluable in my work, allowing me to present complex data in a clear and compelling manner."
Charlotte Williams
United Kingdom"The Executive Development Programme in Building Effective Data Visualizations with R has significantly enhanced my ability to communicate complex data insights in a clear and compelling manner, making my reports more impactful and valuable to stakeholders. This skill has propelled my career forward, opening up new opportunities in data-driven decision-making roles within my organization."
Klaus Mueller
Germany"The course structure was meticulously organized, providing a seamless progression from foundational concepts to advanced techniques in data visualization with R, which significantly enhanced my ability to create effective and impactful visualizations for real-world scenarios. It offered a wealth of practical knowledge that has been invaluable in my professional growth."