
Executive Development Programme in Excel Power BI for Data Analysis
This programme enhances executive skills in using Excel and Power BI for advanced data analysis, insights, and strategic decision-making.
Executive Development Programme in Excel Power BI for Data Analysis
Programme Overview
The Executive Development Programme in Excel Power BI for Data Analysis is a comprehensive, industry-focused training designed for executive-level professionals and managers seeking to enhance their data-driven decision-making capabilities. This program equips participants with advanced skills in data analysis, visualization, and business intelligence using Microsoft Excel and Power BI, enabling them to transform raw data into actionable insights that drive strategic business growth.
Participants will develop key skills in data manipulation, including advanced Excel functions and VBA scripting, as well as in-depth knowledge of Power BI’s capabilities for data modeling, report creation, and dashboard design. The curriculum also emphasizes best practices in data governance, ensuring that data is accurate, consistent, and secure. Learners will gain proficiency in creating interactive reports, enhancing narrative storytelling with data, and leveraging machine learning models to predict trends and outcomes.
The career impact of this program is substantial, as participants will be better equipped to lead data-driven initiatives, make informed strategic decisions, and communicate complex data insights effectively to stakeholders. This program will not only elevate individual professional profiles but also contribute to organizational success by fostering a data culture that supports innovation and growth.
What You'll Learn
The Executive Development Programme in Excel Power BI for Data Analysis is a comprehensive, hands-on training designed to transform data analysis skills into powerful business tools. This program equips participants with advanced proficiency in Excel and Power BI, essential for converting raw data into actionable insights. Key topics include data modeling, advanced Excel functions, data visualization, and interactive dashboard creation, all tailored to meet the challenges of today's data-driven business environment.
By the end of the program, graduates will be able to leverage Excel’s robust features for data manipulation and Power BI for creating sophisticated visual reports. They will learn to build dynamic dashboards and reports that enhance decision-making processes, streamline operations, and drive business growth. This skill set is invaluable for roles such as data analysts, business intelligence specialists, and management consultants.
Participants will have the opportunity to apply their learning through real-world projects, collaborating with industry experts to tackle complex data analysis challenges. This experience not only solidifies their technical skills but also enhances their problem-solving capabilities and strategic thinking. Graduates are well-prepared to advance in their careers, taking on leadership roles that require deep expertise in data analysis and business intelligence.
Programme Highlights
Industry-Aligned Curriculum
Developed with industry leaders for job-ready skills valued by employers worldwide.
Globally Recognised Certificate
Recognised by employers across 180+ countries as a mark of professional excellence.
Flexible Online Learning
Study at your own pace with lifetime access to all course materials and updates.
Instant Access
Start learning immediately — no application process or waiting period required.
Constantly Updated Content
Stay ahead with the latest industry trends, best practices, and emerging insights.
Career Advancement
87% of graduates report measurable career progression within 6 months of completion.
Topics Covered
- 1. Introduction to Excel and Power BI: Learners will be introduced to the basic features and functionalities of Excel and Power BI, including data entry, manipulation, and the initial setup of Power BI reports. They will gain foundational skills in navigating these tools and understanding their potential in data analysis.
- 2. Data Visualization in Power BI: This module delves into creating various types of visualizations such as charts, graphs, and maps using Power BI. Learners will learn how to effectively present data to highlight trends and insights, and develop skills in customizing visual styles and layouts.
- 3. Advanced Excel Formulas and Functions: Focusing on complex formulas and functions in Excel, this module teaches learners to use advanced functions like LOOKUP, INDEX, MATCH, and array formulas for data manipulation. They will gain proficiency in automating data processing tasks and enhancing data analysis through more sophisticated calculations.
- 4. Data Import and Transformation: Here, learners will explore methods for importing data from various sources into Excel and Power BI, including text files, databases, and web services. They will learn techniques for cleaning, transforming, and preparing data for analysis, including handling missing values and inconsistencies.
- 5. DAX for Data Modeling: This module introduces the DAX language for data modeling within Power BI, covering concepts such as tables, relationships, and measures. Learners will develop skills in creating effective data models and writing DAX expressions to derive insights from their data.
- 6. Creating Interactive Dashboards in Power BI: Focused on building interactive and dynamic dashboards, this module guides learners through the design and development of dashboards using Power BI. They will learn to incorporate various visualization types, ensure the dashboards are user-friendly, and incorporate drill-down functionalities.
- 7. Advanced Power BI Report Development: This advanced module covers techniques for developing complex Power BI reports, including the use of parameters, bookmarks, and bookmarks. Learners will learn to create reports that can adapt to user inputs and provide rich, interactive experiences.
- 8. Power BI for Business Intelligence: In this module, learners will explore how Power BI can be used for business intelligence, including data warehousing, data governance, and reporting. They will learn best practices for integrating Power BI into business processes and enhancing decision-making through data-driven insights.
- 9. Power BI and Machine Learning: This module introduces learners to the integration of machine learning models in Power BI, covering topics such as regression, classification, and clustering. They will gain skills in preparing data for machine learning, building and deploying models, and interpreting the results.
- 10. Power BI Implementation and Deployment: The final module focuses on the practical aspects of implementing and deploying Power BI solutions in a real-world business environment. Learners will learn about deployment strategies, security considerations, and best practices for maintaining and scaling Power BI implementations.
What You Get When You Enroll
Secure checkout • Instant access • Certificate included
Key Facts
Audience: Professionals seeking managerial growth
Prerequisites: Basic Excel and Power BI knowledge
Outcomes: Enhanced data analysis, reporting skills
Ready to get started?
Join thousands of professionals who already took the next step. Enroll now and get instant access.
Enroll Now — $199Why This Course
Enhanced Data Visualization Skills: The programme equips professionals with advanced skills in using Excel and Power BI for data visualization. This enables them to transform raw data into insightful visual representations, which are crucial for effective communication and decision-making. Mastery in these tools can significantly enhance the presentation of complex data, making it more accessible and understandable to stakeholders.
Competitive Edge in Data-Driven Roles: In today's data-centric business environment, the ability to analyze and interpret data is highly valued. The programme's focus on practical applications of Power BI and Excel prepares professionals for roles that require robust data analysis skills. This not only enhances their employability but also positions them as valuable assets in any organization, capable of driving strategic initiatives based on data insights.
Increased Efficiency and Productivity: Learning how to use Excel and Power BI efficiently can drastically reduce the time needed to analyze and report data. For example, automating repetitive tasks through Power BI can save hours of manual work, allowing professionals to focus on more strategic activities. This increased efficiency can lead to faster decision-making and better utilization of resources, directly contributing to the success of projects and initiatives.
Your Path to Certification
Trusted by Professionals Worldwide
Course Brochure
Download our comprehensive course brochure with all details
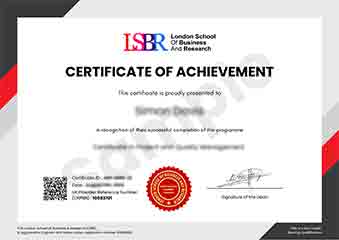
Sample Certificate
Preview the certificate you'll receive upon successful completion of this program.
Get Free Course Info
Enter your details and we'll send you a comprehensive course information pack straight to your inbox.
Employer Sponsored Training
Let your employer invest in your professional development. Request a corporate invoice and get your training funded.
Request Corporate InvoiceWhat People Say About Us
Hear from our students about their experience with the Executive Development Programme in Excel Power BI for Data Analysis at LSBRX - Executive Education.
James Thompson
United Kingdom"The course content was incredibly thorough, providing a solid foundation in Excel and Power BI that has significantly enhanced my data analysis capabilities. I've gained practical skills that are directly applicable in my role, making me more efficient and capable of handling complex data sets with ease."
Isabella Dubois
Canada"This course has been incredibly valuable in enhancing my data analysis skills, particularly in using Excel and Power BI. It has not only made me more industry-relevant but has also opened up new opportunities for career advancement in my organization."
Oliver Davies
United Kingdom"The course structure is well-organized, providing a seamless transition from basic Excel skills to advanced Power BI capabilities, which has significantly enhanced my ability to analyze and present data effectively in a professional setting."